
Simple Guide to Understanding Support and Resistance
Support and Resistance are two of the most closely watched and utilized technical indicators. Although subjective at times, identification of these key indicators is an essential ingredient to successful technical analysis. Even being aware of their existence and location can greatly improve your forecasting and analyzing abilities. Support and resistance are price levels at which either supply or demand for a security is often perceived greater than the other. Stocks will often exaggerate their movement at these key price junctions.
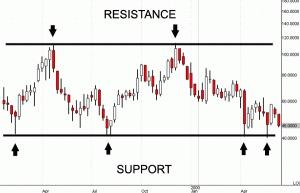
Support is the level at which demand is thought to be great enough to prevent further declines in price. Support is determined by drawing a line connecting the low points (the valleys) on a stock chart. As a stock price declines, investors are mindful of these price levels. It’s almost as if there was some kind of memory inherent in a stock. Human behavior follows certain predictable patterns, much like memory metal.
Resistance is the price level at which supply is thought to be great enough to cap any further appreciation. It’s the reverse action of support. Resistance is determined by drawing a line connecting the high points (the peaks) of the stock price. Stock price action exhibits unusual activity as it struggles to exceed the peak price. Often this market action is explained by investors who are waiting to get even and dump the stock.
Watch for stocks reaching their support and resistance levels. Keep in mind that prices may briefly go beyond your established support and resistance levels, so it is a good idea to have a price “zone” rather than a specific level. Once these “zones” are broken, the relationship between supply and demand has been altered. Broken support levels often become the new resistance levels and vice-versa.
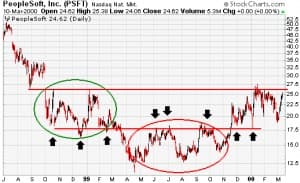
As PFST broke through its level of support, that level became the new resistance zone.
In fact, you can make a logical argument that buying a stock after it makes new highs is the best time. This style of investing is often associated with “momentum investors.” Sudden spurts in volume are followed by quick price appreciation when stocks “break out.” There are numerous stock-screening tools designed to rapidly identify this occurrence in real-time, although it may be a better strategy to trade against this behavior and short them. Following crowd behavior is usually the wrong thing to do.
Moving Averages are also helpful when used along with support and resistance. The moving average is simply a line chart that shows the average value of a security over a series of periods. It does not predict the price direction; rather it defines the current direction with a lag because it is based on past prices.
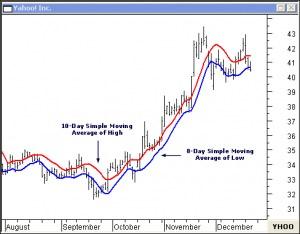
Moving averages can exhibit the same effect as support and resistance when prices approach them. But, unlike regular support and resistance levels, they do not remain at one stationary level; they move across a chart. Simple averages help form the building blocks for many other technical indicators.
Just like support and resistance, stocks exhibit short-term predictable behavior at the 50-day and 200-day moving average lines. These lines drawn by the computer become support and resistance lines just like the lines drawn from peak to peak and valley to valley. Although you should never make an investment solely based on a technical indicator, having an understanding of these simple concepts can greatly improve your results.
Since the primary goal of this exercise is to anticipate price behavior, you must look at what other people are looking at. In that case it would be the 50-day and the 200-day moving averages.Draw one line connecting the high points of the moving average and one connecting the low points. The low line will be your support and the upper line will be your resistance.
This is an excerpt from The Investment Survival Guide. Contact Michael Torrence at 435-658-1934 and ask for your free copy of The Investment Survival Guide.